XAU/USD and Iran Gold Price: How Spot Gold and the Dollar Drive Tehran 18K
How XAU/USD and Iran gold price are linked: the intrinsic-value formula for 18k gold, why the Tehran dollar dominates, timing lags and the local bubble.


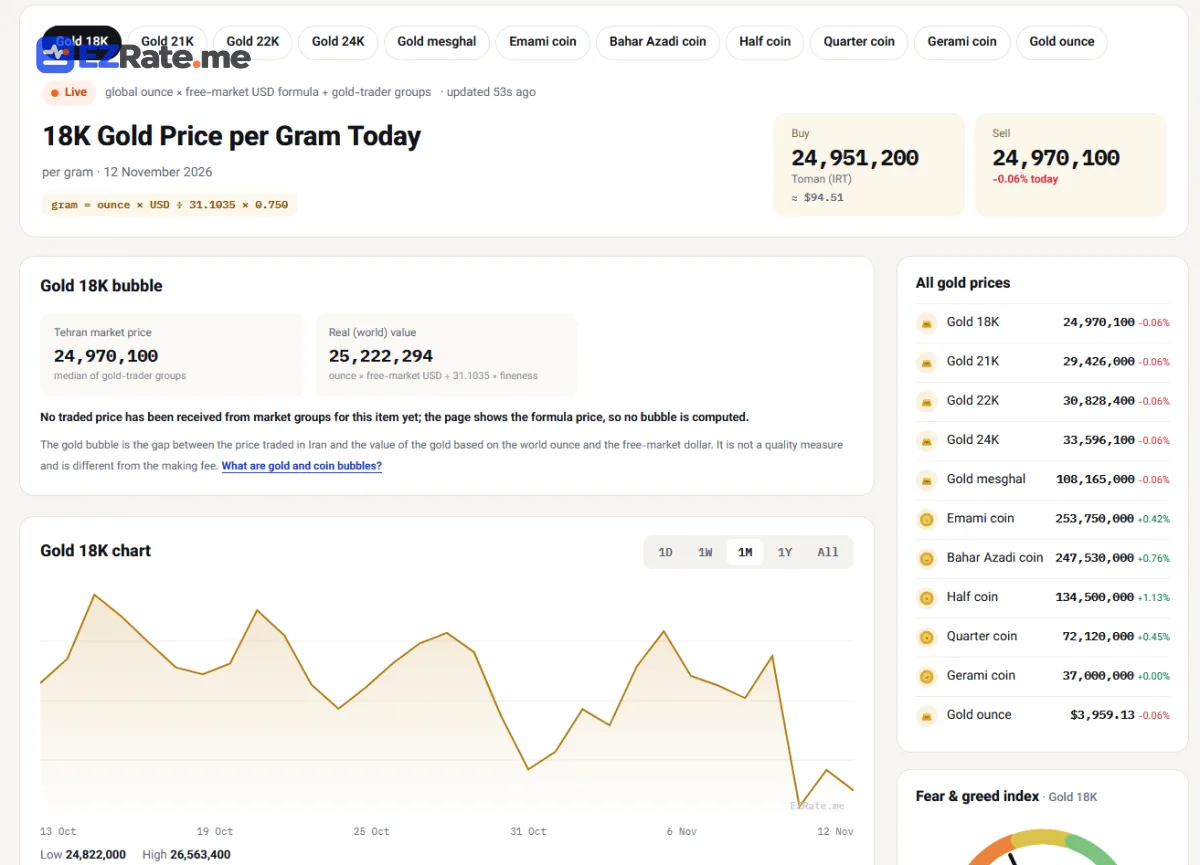
- The intrinsic value of 18k gold in Tehran ≈ XAU/USD × USD/IRT × 0.75 ÷ 31.1035; both factors pass through roughly one-for-one.
- Because the Tehran dollar is usually more volatile than spot gold, it explains most day-to-day moves in Iranian gold prices.
- The residual — market price over intrinsic value — is the local bubble, driven by domestic demand.
Analysts often expect Iranian gold to follow the global gold price. Sometimes it does; often it moves for entirely different reasons. The relationship between XAU/USD and Iran gold price is exact in its formula but noisy in practice. This article explains the mechanics and shows how to measure them with data.
XAU/USD × USD/IRT × 0.75 ÷ 31.1035. A 1% move in either spot gold or the Tehran dollar moves this intrinsic value by about 1%. Since the Tehran dollar is usually more volatile, it typically explains more of the daily variation. The difference between the market price and the intrinsic value is the local bubble.Part of the Iranian Rial exchange rate API guide. See also our gold bubble explainer and how the gold price is calculated.
The identity
OUNCE_G = 31.1035

def g18_intrinsic(xau_usd, usd_irt):
    return xau_usd / OUNCE_G * usd_irt * 0.75

def bubble(g18_market, xau_usd, usd_irt):
    return g18_market / g18_intrinsic(xau_usd, usd_irt) - 1
In log terms: ln(g18) = ln(XAU) + ln(USD) + ln(1 + bubble) + const. Daily log returns of Tehran gold therefore decompose into spot-gold returns, dollar returns and a change in the bubble.
Sensitivity
| Scenario | XAU/USD | USD/IRT | Intrinsic 18k |
|---|---|---|---|
| Spot gold up | +2% | 0 | ≈ +2% |
| Dollar up | 0 | +2% | ≈ +2% |
| Both up | +2% | +2% | ≈ +4% |
| Offsetting | +2% | −2% | ≈ 0 |
Measuring the relationship
import os, requests, pandas as pd, numpy as np

H = {"X-API-Key": os.environ["EZRATE_KEY"]}
def close(sym, **kw):
    d = requests.get(f"https://api.ezrate.me/v1/history/{sym}", headers=H,
                     params={"interval": "1d", "from": "2025-10-01", "to": "2026-10-01", **kw}, timeout=30).json()["data"]
    s = pd.DataFrame(d).assign(t=lambda x: pd.to_datetime(x.t, utc=True)).set_index("t")["c"]
    return s.rename(sym)

df = pd.concat([close("g18"), close("ounce"), close("usd")], axis=1).dropna()
r = np.log(df).diff().dropna()
print(r.corr().round(2))

import statsmodels.api as sm
X = sm.add_constant(r[["ounce", "usd"]])
print(sm.OLS(r["g18"], X).fit().summary().tables[1])
Expect coefficients near 1 for both factors over long windows, with the residual capturing bubble changes. Note that ounce history may have gaps on global weekends while Tehran trades on Saturday; align calendars before regressing.
Timing effects
- Overnight moves: spot gold trades while Tehran sleeps; the effect appears at Tehran’s open.
- Weekend mismatch: global markets are closed Saturday–Sunday; Tehran trades Saturday, so only the dollar and bubble move.
- Holiday gaps: long Iranian holidays accumulate global moves that hit prices on reopening.
Can you arbitrage it?
In theory a persistent bubble invites arbitrage between world gold and Tehran gold. In practice, import/export restrictions, transport and assay costs, financing and capital controls keep the bubble alive for long periods. It is a measure of local sentiment more than an exploitable spread.
Practical uses
- Gold shops: show intrinsic value and bubble alongside prices to build trust.
- Analysts: separate global and local drivers before forecasting.
- Developers: compute the bubble in your app from three API symbols — see the Iran gold price API.
What this means for pricing and analysis
For gold shops, the identity explains why prices can change sharply at the morning open after a quiet night in Tehran. For analysts, it means a forecast of Iranian gold is really two forecasts — the global gold price and the Tehran dollar — plus a view on local sentiment captured by the bubble. Tracking the three components separately gives far better explanations of past moves than looking at the 18k price alone.
Persian-speaking readers will find a non-technical version in the effect of the global ounce on Iranian gold.
As a rule of thumb, check all three inputs — ounce, dollar and bubble — before explaining any single day’s move in Tehran gold.
Related live rates: 18K gold price, US dollar rate, Emami coin price.
Comments (0)
Comments are shown after review. Sign-in is needed to send.