Historical USD to IRR Data: Free-Market Candles via API for Analysts
Access historical USD to IRR data as hourly or daily free-market OHLC candles: parameters, time zones, pandas and R examples and caveats about thin periods.

- `/history/{symbol}` returns hourly (`1h`) or daily (`1d`) OHLC candles of the Tehran free-market rate, timestamped in UTC and based on the sell side.
- The same endpoint serves EUR, AED, gold, coins and USDT, so cross-asset research uses one consistent methodology.
- Account for weekends, holidays and low-source periods before computing volatility or returns.
Official IRR series are easy to find; reliable free-market series are not. Yet for inflation research, pass-through studies, risk models or simply back-testing a pricing rule, the free-market rate is the one that matters. This guide shows how to access historical USD to IRR data from the EZRate API and how to use it responsibly.
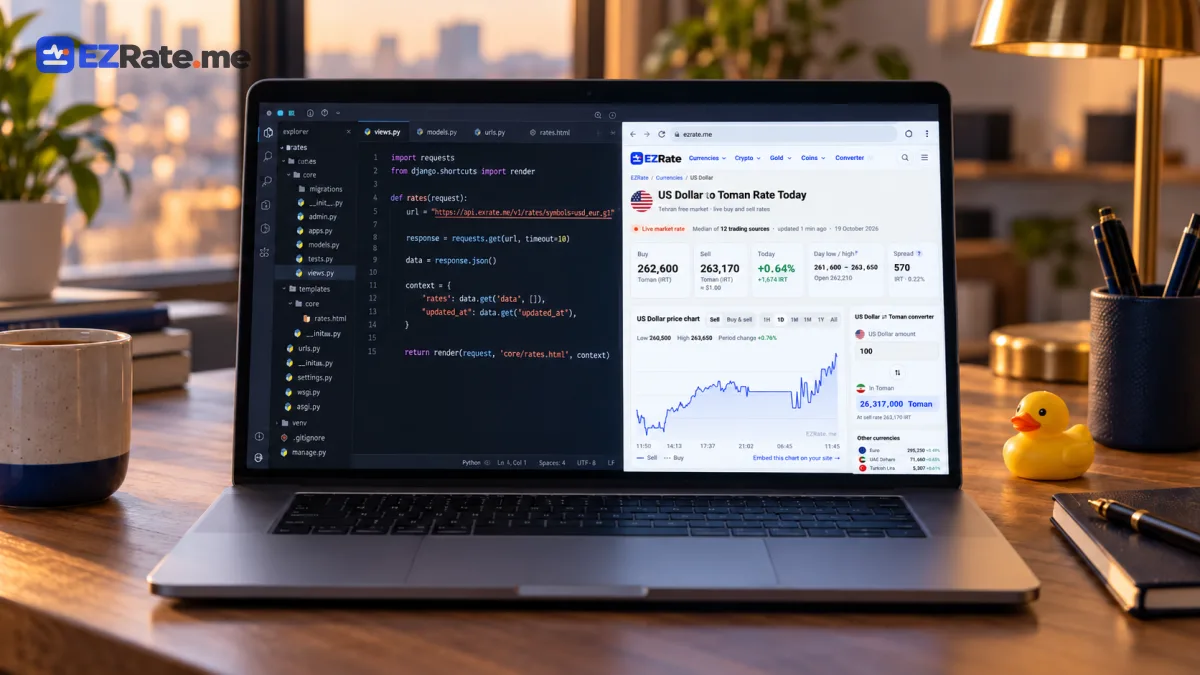
GET /v1/history/usd?interval=1d&from=YYYY-MM-DD&to=YYYY-MM-DD (or interval=1h). You get candles with t, o, h, l, c, in UTC, built from the sell rate, in Toman (or Rial with quote=IRR). History depth depends on your plan. The same endpoint works for EUR, AED, gold, coins and USDT.Part of the Iranian Rial exchange rate API guide.
Request parameters
| Parameter | Values | Notes |
|---|---|---|
interval | 1h, 1d | Hourly or daily candles |
from, to | ISO dates | Inclusive range; long ranges may be capped per request |
market | tehran (default), herat, sulaymaniyah, dubai, istanbul | Market-specific series |
quote | IRT (default), IRR | Unit of the candles |
curl -s -H "X-API-Key: $EZRATE_KEY" \
"https://api.ezrate.me/v1/history/usd?interval=1d&from=2026-01-01&to=2026-10-01"e=IRR" | jq '.meta, .data[0]'{ "symbol": "usd", "interval": "1d", "market": "tehran", "quote": "IRR", "count": 274 }
{ "t": "…", "o": 0, "h": 0, "l": 0, "c": 0 }Python: load, resample, analyse
import os, requests, pandas as pd, numpy as np

def history(symbol, start, end, interval="1d", **kw):
    r = requests.get(f"https://api.ezrate.me/v1/history/{symbol}",
                     headers={"X-API-Key": os.environ["EZRATE_KEY"]},
                     params={"interval": interval, "from": start, "to": end, **kw}, timeout=30)
    r.raise_for_status()
    df = pd.DataFrame(r.json()["data"])
    df["t"] = pd.to_datetime(df["t"], utc=True)        # ISO 8601 timestamps, UTC
    return df.set_index("t").sort_index()

usd = history("usd", "2026-01-01", "2026-10-01")
ret = np.log(usd["c"]).diff().dropna()
print("annualised vol:", ret.std() * np.sqrt(252))
print(usd["c"].resample("ME").last().pct_change().tail())
For multi-asset studies, fetch eur, aed, g18 and usdt the same way and join on the index.
R
library(httr2); library(dplyr)
req <- request("https://api.ezrate.me/v1/history/usd") |>
  req_headers(`X-API-Key` = Sys.getenv("EZRATE_KEY")) |>
  req_url_query(interval = "1d", from = "2026-01-01", to = "2026-10-01")
df <- resp_body_json(req_perform(req), simplifyVector = TRUE)$data |>
  mutate(t = as.POSIXct(t, tz = "UTC"))
summary(df$c)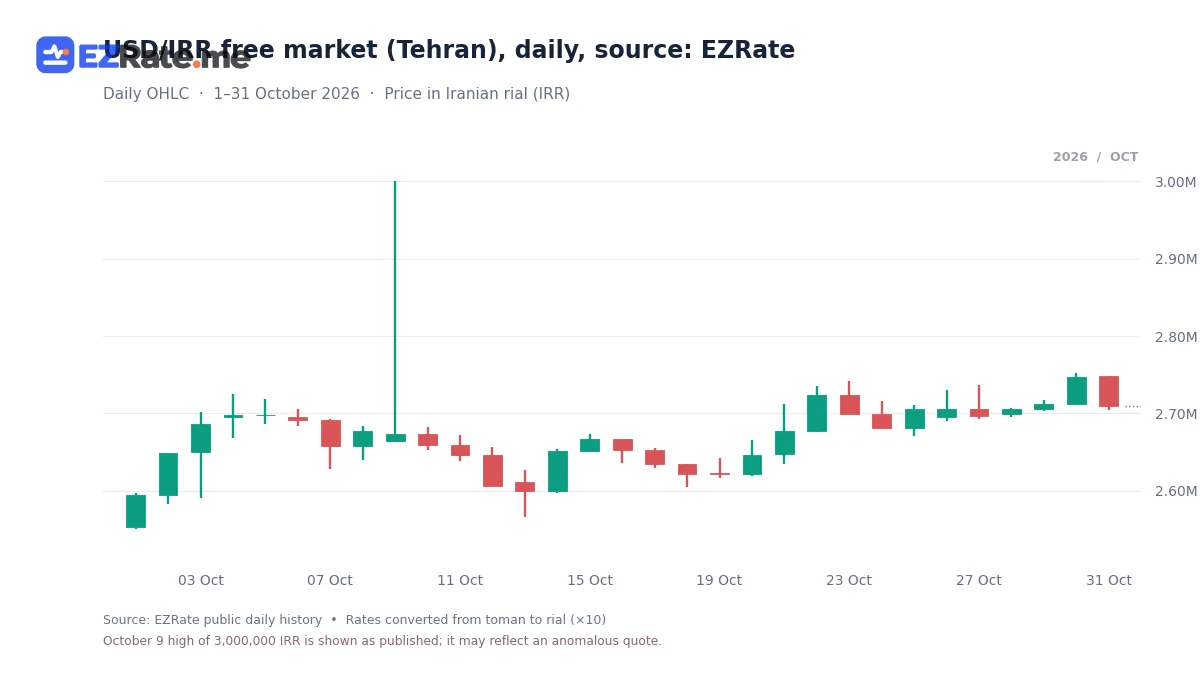
Caveats every analyst should know
- Time zone: candles are in UTC; Tehran is UTC+3:30. Daily boundaries do not align with the Iranian business day.
- Trading calendar: Friday and public holidays have little or no cash trading; decide whether to drop or forward-fill them.
- Thin periods: night hours and holidays can have few sources. Use hourly data with care, and prefer daily closes for volatility.
- Sell side: candles are built from the sell rate; spreads widen in stress, so the mid can differ.
- Survivorship of sources: the methodology has evolved; document the retrieval date in your paper.
Good research practice
- Cite the source and retrieval date.
- Save the raw JSON you analysed for reproducibility.
- Compare with official series only after labelling both clearly — see official vs free market.
- For gold, compute intrinsic value from the ounce and USD to separate the bubble: XAU/USD and Tehran gold.
Need data in a spreadsheet instead? See live rates in Google Sheets and Excel. The public history page lets you browse charts without code.
US Dollar272,000Toman−0.11%Building a reproducible dataset
For a paper or an internal report, pull the data once into versioned files instead of calling the API every time the notebook runs. Store the raw JSON response per symbol and request date, then build your analysis tables from those files. Record the retrieval date, the API parameters and the methodology version in a README next to the data. If you later extend the series, fetch only the new range and append it, so earlier results remain reproducible.
- Daily closes for macro work (pass-through, inflation, regressions).
- Hourly candles for intraday behaviour around news, with care around thin night hours.
- Market-specific series (
market=herat,dubai) for lead-lag and spread studies.
When comparing with gold, compute the intrinsic value from the ounce and the dollar so you can separate world price, currency and local premium: see XAU/USD and Iran gold price.
Combining with other series
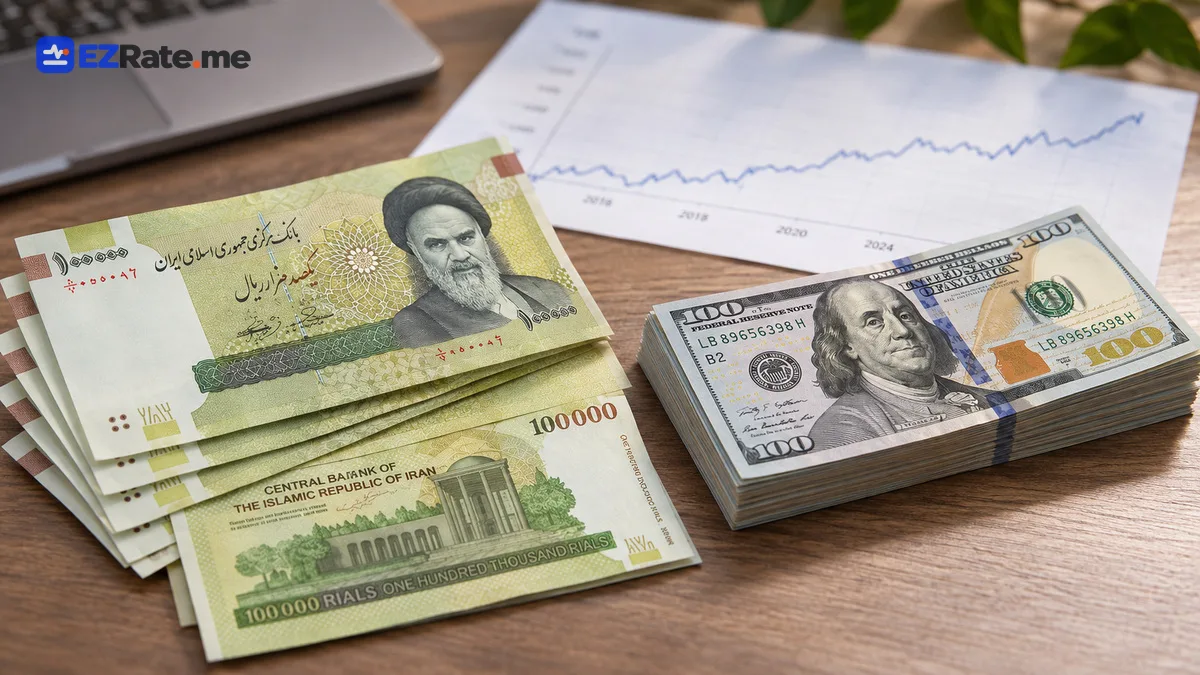
Free-market exchange rates become far more informative next to other data: official rates, consumer price indices, import volumes or wage data. Align frequencies before merging (resample daily candles to monthly closes for macro series), use the same time zone and document every transformation. Plotting the free-market dollar against an official series on a log scale shows the gap between them more clearly than any table.
Related live rates: US dollar rate, 18K gold price, Emami coin price.
Comments (0)
Comments are shown after review. Sign-in is needed to send.